
change
your world
Start your journey
Moving abroad? Use Expatica as your compass to guide you through every step of your new life.

Inspiration

The difference between expats and immigrants
What distinguishes expats from immigrants? The manner in which these terms are employed reflects perceptions of immigration and those engaged in the process.
Read More
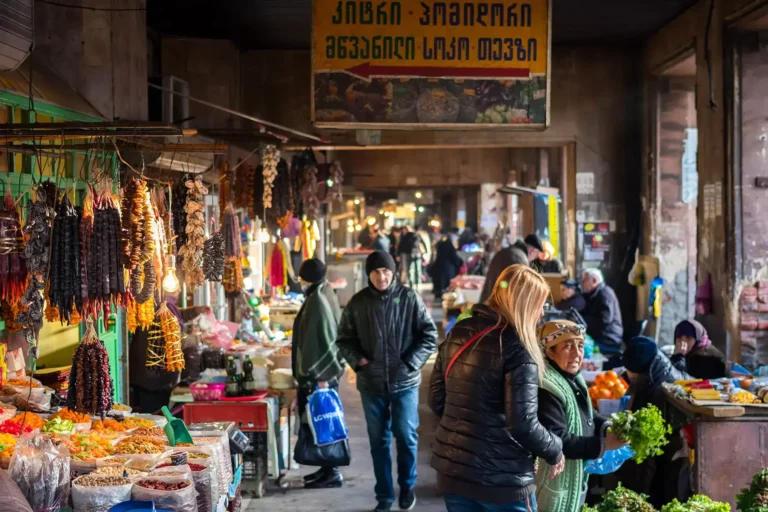
The top 10 cheapest places to live as an expat
Dreaming of life abroad but concerned about affordability? Explore this list of the top 10 cheapest places for expats live.
Read More
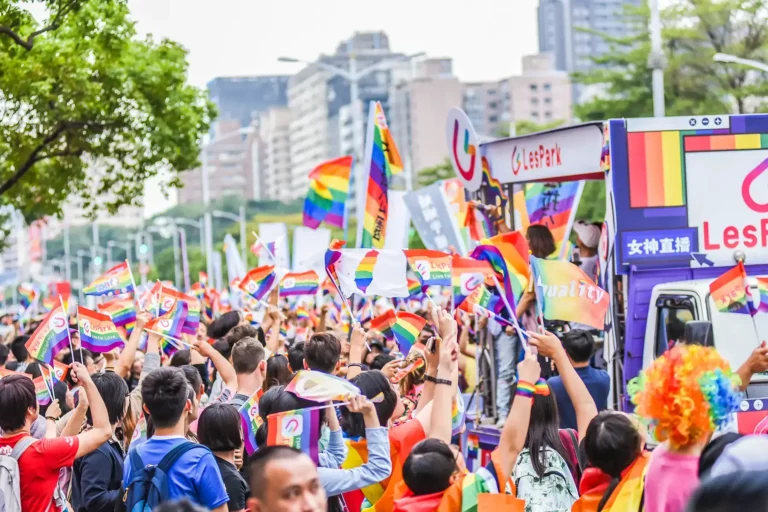
The most LGBTQIA+ friendly countries for expats
Same-sex relationships are criminalized in many countries, with diminishing rights for the LGBTQIA+ community in certain places. Fortunately, many LGBT-friendly countries offer a safe environment.
Read More
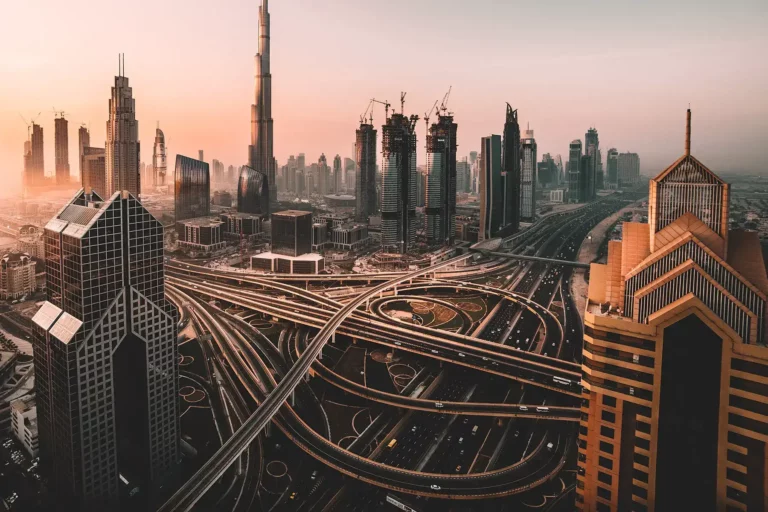
The top 10 easiest countries to immigrate to as an expat
Whether you're seeking employment in your ideal destination or exploring a fresh lifestyle for your family, this article explores the easiest countries to which you can immigrate.
Read More

Best countries for an entrepreneur visa
If you have a business idea but feel your home country isn't the right environment, explore entrepreneur visas for immigrants and expats in these startup-friendly countries.
Read More

Explore
Spotlight
Discover expat life in Thailand
Friendly charm, diverse culture, welcoming community
Read moreExplore


Meet Expatica


Sign up for our newsletter

We support internationals in each step of their journey.